
By Kate Sotir, Cooper Sarafin, Anderson Fan, Shep Green, VI Form and Mo Liu, V Form
Math Modeling: Using Math for Flight Path Safety
Part 1:
The problem at hand is to create a model, a rating system, that would inform potential flyers of the safety of a particular flight. Our solution includes a mathematical equation that gives us a number between 1 and 100, depending on the inputs. Although the values themselves indicate the safety level of flights, we do not want to our audience to read into the numbers: a flight with a safety index of 63 should not be considered a more dangerous flight than a flight with a safety index of 67. Therefore, to make our model directly presentable to our audience, we classified the possible outcomes into ratings. A safety index ranges from 1 to 20 would have a rating of ★, from 20 to 40 would have ★★, 40 to 60 would be ★★★, 60 to 80 ★★★★, and finally, 80 to 100 would have the highest rating of ★★★★★, and flights that fall under this rating would be the safest choice based on our model.
One major assumption that we made during the creation of our model was assuming that there is no possibility of human error involved in any of the flights that we model. However, in reality, most major plane crashes are caused by errors of the pilot. We chose to make this assumption because of our given time restraint and the amount of resources that we had at our disposal. It was not realistic to fully examine each pilot and record the possibility of human error. Since we do not have access to the information of each individual pilot, we assume that the longer the flight, the more tired the pilots get on the plane and, therefore, the more dangerous the flight gets. Relating again to the path of the flight, we assumed that it is easier to fly over water than it is over mountains. Although none of us have ever flown a plane, we agreed that mountains would make a flight more difficult to maneuver. Another assumption is that all of the aircraft being used were fully functional, regularly examined, and fully repaired. Again, we made an assumption about the sturdiness of the plane because we cannot check each individual plane’s safety. However, we do have fatality rates of each particular type of aircraft given by the companies.
Our model consists of five main variables: time of day, weather conditions, aircraft type, the difficulty of the flight route, and the airline company’s safety index. The first factor, time of day, is less correlated with time than the visibility. According to data, although there are not necessarily more accidents happening at night than during the day, the accident fatality rates are higher since it is harder to provide first-aid and perform primary research at night. The graph of the percentage of accidents resulting in fatality by lighting conditions shows that only 9.1% of the accidents happening at dawn result in deaths while 42.4% happen at night. Therefore, we give the time of day factor a scale from 1 to 4 (dawn: 1, day: 2, dusk: 3, night: 4). Weather conditions consist of five subsets that add to the final value of this variable. These subsets are: is there a storm within 20 NM of the flight, is it cold with precipitation or low clouds, is visibility compromised by rain or snow, is the runway affected by ice or rain or snow, and are the crosswinds above the FAA limit. Each of these subsections carries a numerical ranking, so the final weather variable could have a value between 1-15, with 1 being pristine flying conditions and 15 being extremely dangerous. For the variable that is the aircraft type, we found the fatal crash rates per one million flights. As this number was usually a decimal, we decided to multiply it by 10 to give it a value closer to those already within our model. The lower this number is, the better, because that means they have less fatal crashes per million flights. Finally, we looked at the airline safety index. Once again, this variable consists of five subsections which include: are they IOSA certified, are they on the EU blacklist, are they fatality-free over the last 10 years, are they endorsed by the FAA, and do they meet the ICAO safety parameters. Therefore, as each checkpoint is 1 point, this variable produces a number between 0-5, with the safest airlines earning a 5 and the most dangerous ones earning a 0. All of our airlines except one, Malaysian Airlines, scored a 5. Lastly, we considered the route of the flight. Since we assumed that flying over water is safer than flying over mountains because there is a bigger chance of survival, the flight would have one point if it flies over mountains. If the flight takes off, lands, or flies over a war zone or a region in military conflict, we consider that to be unsafe and any qualified flight would gain 2 points. In addition, as we explained earlier, we assume any pilot flying over the course of 8 hours is tired enough to become a risk. The final flight route variable could have a value between 1-4, with 1 being a cleared route and 4 being highly potentially risky.
There were some variables that we briefly considered adding to our model, but upon further evaluation, we realized that they were either not feasible or not relevant to our model. The first one was the evaluation of the pilot. We thought that this could be a major factor in whether or not a flight is safe, but while researching this topic we realized we do not have the proper resources to accurately explain each pilot’s individual safety rating and could not gather enough data to complete this variable. Another variable that we decided to omit was whether or not birds were present on the flight path. As there have been crashes caused by birds being sucked into the engines of planes, we thought that they might have an impact on the safety of a flight. We soon learned, however, that this was another variable that we could not calculate based on our resources. We also decided that, since birds exist all over the world, it could be assumed that the possibility of birds causing a crash is more or less constant no matter where the flight is, and therefore, it would not affect our model. The final variable that we decided to cut out was the jet stream. Initially, as the jet stream can often shorten or lengthen flights due to its power, we thought it would have some impact on the safety of the flight. Upon further research, we discovered that it did not, in fact, affect the safety of the flight in any way. Therefore, we decided to omit the jet stream from our list of variables.
To test the strength of our model, we decided to input data from actual flights into our equation. By picking some flights that were obviously dangerous and some that were clearly safe, we could begin to have an understanding of how accurate our model was. The most obvious dangerous flight produced a ★, which is the most dangerous output that our model produces. The flight that we assumed would be safest gave us a ★★★★★, the highest and safest rating that we can get. As our initial assumptions about the safety of the flight lined up with the results, we believe our model is an accurate representation of the safety of a flight. There still exist some weaknesses in our model, however, such as the fact that our guidelines for safety are not necessarily in line with other people’s. We placed heavy values on weather, while someone else might have emphasized the time of day more than us. Moreover, opinions on the harshness of the weather could change the result of the safety index. In addition, we have no clear definition of what constitutes a war zone, which is a major factor in our result. Finally, some airplane crashes are caused by human error, regardless of any measurable conditions going on at the time. In our model, we do not account for human error. as it is not necessarily quantifiable.
After observing all the data we collected about flight safety, we were determined to utilize a ranking function to calculate the safety index for different flights.

is our function in this case. S represents the safety index of one flight, A represents the safety index for different airline companies, T stands for the time of day, R indicates the difficulties of the flight route for one flight, W represents the weather conditions, and C stands for the fatalities for different types of aircraft. Both the C, T, R and W variables would negatively influence the result of S, so we decided to put all these variables under A, our safety index for different airline companies; as the value of C, T, R and W increases, S will decrease, which fulfills our requirements for this model. The reason why we multiplied T, R, W instead of adding them together is that we think T, R and W are connected, and each one of these three values may influence the other two. In addition to that, we also multiplied C by 10 and A by 100. The reason triggered us to do so is that we consider C as a more important factor compared to T, R, and W, and multiplying A by 100 could give us a big enough S to generate our results.
In order to verify our model, we chose 6 flights to calculate their safety index utilizing our model. Instead of choosing randomly, we deliberately picked out these flights that included either extremely safe or extremely dangerous situations in order to test out the accuracy and sensitivity of our model. For example, the Turkish airline TK415 has bad weather conditions at both takeoff and landing locations, and the fact that it is flying from Istanbul to Moscow (two countries that are currently in political tension) at night stresses the risks that the passengers are taking. Therefore, before calculating the safety index of this flight, we already acknowledged that we would eventually obtain a very low safety index due to its T, R, and W values and decided to thus use it to test the lower perimeter of our model. We then go on to input the corresponding values for each factor into the equation (as can be referenced in the following chart) and obtain a value of 15.2, which would qualify as a ★ rating flight using our system. In contrast, JetBlue flight JBU896 from NY to DR is what we assumed to be a very safe flight and used to test the upper bound of our safety index model. The aircraft type of this flight is AirBus A320 which has a fatal crash value of 1.1; the flight takes off at dawn, and the weather in both locations is ideal. We obtain a safety index value of 98, which qualifies the flight as a ★★★★★ choice. From these two, and the other flights that we have used to test our model, it is clear that our model allows us to distinguish the difference in safety in flights.

Part 2:
We were tasked with developing a more accurate system which could be used to find crashed airplanes. We propose a list of instructions to follow that goes as follows: determine the last known location; determine if it is an emergency landing or crash; if it’s an Emergency Landing, use the equation, y= -(1/glide ratio)x + altitude; if it is a crash, find the plane’s initial and terminal velocity in both horizontal and vertical directions, into the following two equations:
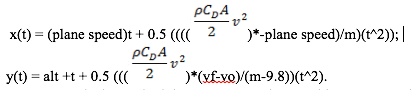
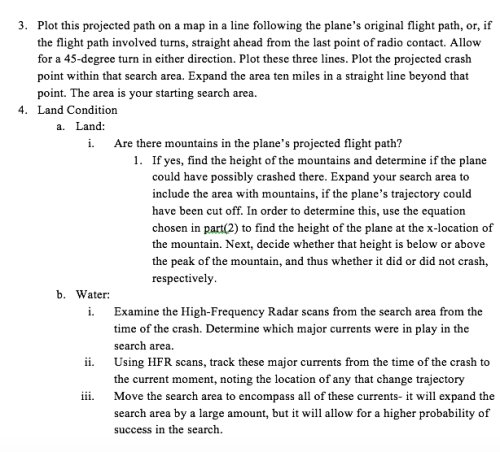
Here is the method that we suggest for the searching team consider. Plot this projected path on a map allowing for 45 degrees of deviation in either direction, providing your starting search area. You should then consider the geographical conditions in the area the plane has gone down. If over a landmass, determine any mountains or other obstacles the plane could have crashed on. If over water, you should examine the high-frequency radar scans to determine the major currents in play. Over time, move the search to include the drift of these major currents.
We have made several assumptions in this model, the first of which being that a crashing plane follows a linear path due to the instruction provided to pilots to descend in a controlled glide. We also assumed that all engines would have failed. In order to get a constant speed during descent, we decided it was necessary to not consider the possibility of some engines still working. We assumed that ATC would have lost communication with the plane after it had been told of engine failure. Without this notification, the timetable of search and rescue would be skewed and almost impossible to model accurately. Our last assumption is that HFR scans track surface currents only. We do not know enough about underwater currents to track a sunken plane.
Our model is a series of steps for air traffic control (ATC) to follow when they know that a plane has gone missing. Here are the steps:
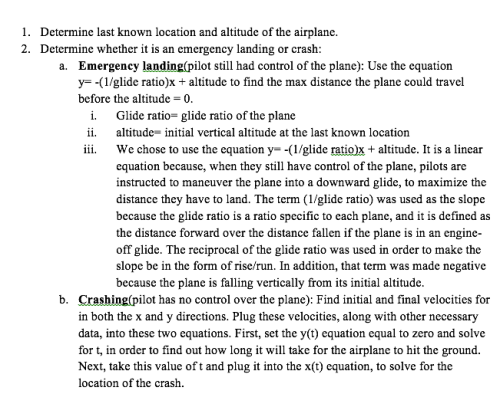
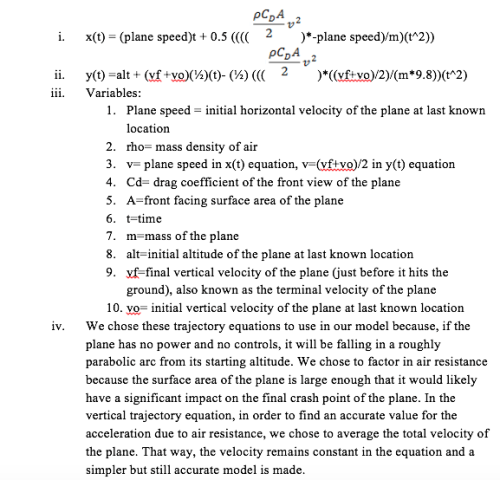
Our model has particular strengths and weaknesses within the multi-step evaluation. To begin with, a strength is that we decided to factor in the air resistance into the free fall portion of our model. Although it is very complicated to calculate, we determined that our model would be made stronger if we did not ignore this influential part of a crash landing. In addition to this, the fact that we have accounted for each scenario of an airplane crashing and whether or not the pilot has control of his plane is a strength of our model. Weaknesses, however, do exist within our model, as well. For example, we rely heavily on information that is relayed to Air Traffic Control. If a plane loses power or it’s ability to send information, the search area becomes much larger because we must use the location from their last known point of contact. In addition, since we averaged the velocity in the vertical free-fall equation, our landing point may be less accurate than if we had examined the change in velocity at every point. Our final weakness has to do with aquatic crashes, and it is our inability to exactly determine currents in the ocean. As we could not find the accepted system for backtracking these currents, we decided to create our own system. This may be weaker than the standard model already used while searching for planes that have crashed into the ocean.
We believe that our model is inclusive and justified based on the reasoning behind it. The plane cannot be behind the last known spot, and therefore it is intuitive to set the starting point at the last known location based on information acquired from ATC. We also recommend the searching team to go beyond the hypothetical crashing point of the aircraft by 10 miles. We believe this is an acceptable distance because it accounts for the potential, unpredictable differences between the predicted scenario and the actual (the angle of descent might be steeper/shallower, terminal velocities of the aircraft might be different than the last reported values). In order to test our model, we set up a hypothetical crash. We chose Boeing 747 to be our model aircraft, cruising at the speed 255.56m/s(575 mph), altitude 13716 m. The drag coefficient of this particular type of aircraft (Cd) is .031, with a front head surface area of 180m2. The initial vertical velocity was estimated to be 10 m/s, while the terminal velocity of the plane is 308.67 m/s. We found that the plane took 2.5 minutes from the last point of contact to crash, and that it is estimated to have traveled 49528.5 m, or about 30 miles. Using these results with the model that we proposed, this provides a search area of an estimated 1257 square miles. We feel that this is a reasonable search area.
All members of the class contributed equally on this project in terms of researching, devising the model, calculating and testing, and writing up the report.
*****
The Assignment:
Let’s Fly Away
You are an expert in aviation. You have been hired as a consultant for two different groups. One is a frequent flyer group and one is an association of airline executives.
Part I:
Both groups are interested in a way to predict the safety of a particular flight. You are charged with coming up with a model that would give a safety index for a particular flight considering many factors such as time of day, type of aircraft, flight route, pilot and personnel, time of year, weather and other factors you can think of.
Write a report to the two groups thoroughly explaining your safety index and how you arrived at it. Make sure you include any assumptions you made in creating the model. You also should mention any strengths, weaknesses and limitations of your model. Note, the frequent flyer group are not necessarily mathematicians so make sure the model is easy to use for a flyer who wants to know the likelihood of their plane crashing.
Part II:
The association of airline executives is bothered by the fact that the remains of Malaysia Airlines Flight 370 have never been found. They would like you to create a model that would help search for missing flights. Consider what information you would normally have for a plane in flight and use it to create a model that gives directions on areas to search. Keep in mind that there may be a difference if the flight is over land or water.
Write a report to the executives that includes your model, an explanation of it and justification for the model. Make sure you include any assumptions you made in creating the model. You also should mention any strengths, weaknesses and limitations of your model.
As always, include any sources you used in your models.