
By Steven Li & Gabriel Xu, V Form and Finn Reams & Thee Ngamsangrat, VI Form
Math Modeling: Improved System for Ranking Colleges
Summary
Our task was to rank undergraduate colleges based on major elements that were most important to us. To solve the problem at hand, we first came up with six general elements of a college that held significance and found specific variables that would quantify each element. After putting all the variables into a ranking function, we adjusted the weights put on each category in correspondence with the importance we believed they contributed. We applied our model to both normal and extreme cases for testing, and we drew a 3D graph that showed the relationship between the final result with two of the variables as well.
Restatement of the problem
In this problem, we set out to rank undergraduate colleges in the U.S. by creating a ranking function based on factors that we deemed to be most important. We grouped these factors into a few categories: admission selectivity, resources, success of graduates, financial aid, Division I athletics, and student experience.
Assumptions and hypotheses
In order to conduct our ranking process in a relatively accurate and practical manner, we make some assumptions. We assume that the information we gathered from various sources was accurate and up-to-date. We also assumed that the costs of living of all place in the United States are the same.
Analysis of the Problem
When trying to come up with a coherent ranking function that could represent the various aspects of a college thoroughly, we decided to group our variables into six categories, each denotes one element significant to the performance of a college — student selectivity; financial aid; graduation; resources; Division I athletics and student experience. We found that while some categories could be quantified easily with one single variable, some required a multi-variable approach. We adjusted our model accordingly which ultimately contained six categories and ten variables.
Design of the model
The variables we choose to quantify the above-mentioned categories are:
- student selectivity: average SAT scores, average high school GPAs for enrolled students and acceptance rate;
- financial aid: total financial aid/total undergraduate population;
- post-graduation performance: average mid-stage salary of graduates;
- resources: total endowment, average professor salary, and student-faculty ratio;
- athletics: number of Division I athletic teams;
- student experience: survey rating from current students.
Due to the nature of these variables, the data we gathered was hard to combine because of the difference in numbers (i.e. 4.0 GPA vs. 2400 SAT). In order to weigh the categories properly and to achieve a reasonable result in the end, we assigned different coefficients to the variables so that the value calculated from each of the six categories reflects the significance the aspect holds respectively. It is represented in our model that we value Student Selectivity the most, followed by Resources, Graduation Performance, Financial Aid, Athletics and Student Experience.
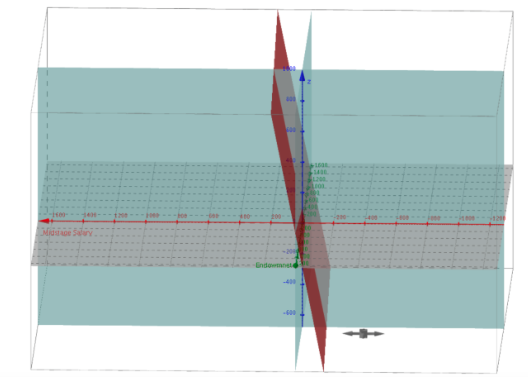
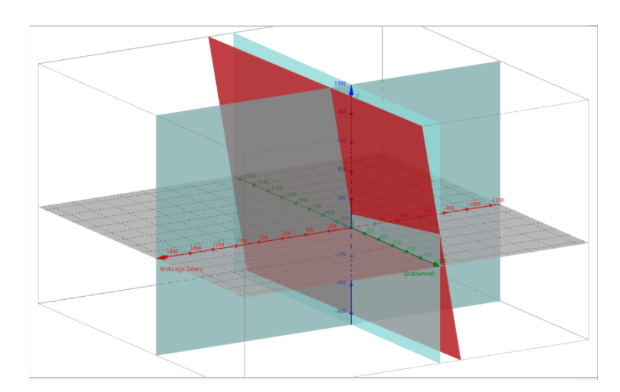
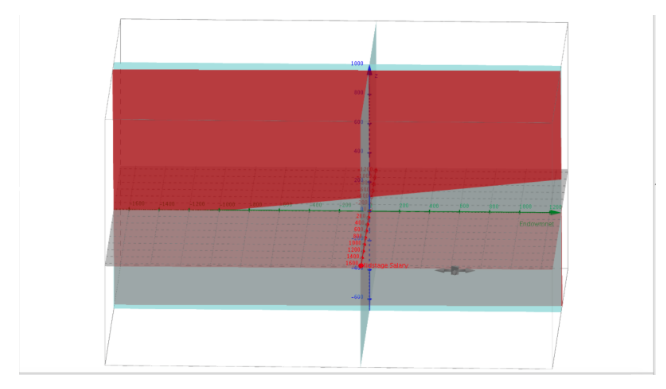
In the graphs shown below, the red axis represents Mid-Stage Salary, the green axis Endowment, and the blue axis the final results, whereas all the other variables in the function are held constant at average values among the samples. Due to the nature of the two variables we chose, it is only reasonable to look at the first octant as both data for Mid-Stage Salary and Endowment stay positive at all time. The blue “screens” at x = 0 and y = 0 are set to help visually. It is evident in the graphs that both variables have a positive and linear relationship with the final result. Therefore, in this case, Mid-Stage Salary and Endowment are independent variables whereas the final result is the dependent variables.
Justification of the model
Our model is effective because it incorporates a wide range of the important elements of colleges. In that way, our model is relevant for many high school students. For example, we include the number of Division I sports teams at each college to make our model relevant for student athletes and for students looking to engage in the fanfare of college sports. However, we did not weigh this as heavily as a number of other factors which are more important to a majority of students such as admission selectivity (acceptance rate).
We also inputted data from several universities and colleges to test our model. We used statistics from Harvard University, Stanford University, Brown University, Georgetown University, Boston College, George Washington University, and Boston University and found that the relative ranking of these colleges is reasonable. For extreme examples, we used a mix of liberal arts, research and art institutes. Among them, only California Institute of Technology had a total score over 200. We think the cause of lower scores is mainly the low endowment of these small institutes in contrast to the larger universities. Our sample data can bee seen by clicking here.
Your Solution
A=average SAT score of enrolled students
B=average high school GPA of enrolled students
C=acceptance rate
D=total amount of financial aid/total number of students (10^4 USD/person)
E=mid-stage salary for graduates (10^4 USD)
F=total endowment (10^9 USD)
G=average salary of professors (10^5 USD)
H=student-faculty ratio
I=number of Division I athletic teams
J=student rating ranging from 1-5
Total Score=(A/500+B)/C+5D+5E+(F+G)/H)+I+5J
(We put C and H in the denominator in their respective parts of the function because Acceptance rate and Student-faculty ratio are inversely proportional to the competitiveness of the college.)
Analysis of the model
We consider our ranking function to be a thorough evaluation of undergraduate colleges as it considers several aspects of each school, thus, allowing for independent and unique schools to be judged fairly across a broad spectrum of criteria. Another strength of our function is its simplicity as once all the data is inputted into the model, all the strengths and weakness of a college is quantified by a single number that is easily compared with other colleges.
The weighting is largely arbitrary because it is based on our opinions of what factors are most important and by how much. To create a less biased and more representative model, we would need to survey a random sample of high school students to determine which factors are most important. Then we would be able to base our model entirely off of the elements that the average American high school student regards to be most significant in determining the best college. However, while a model of that nature would represent the average American high school student, it would not be very helpful on a case-by-case basis. A case-by-case model would require the weights for each element to be variable.
References
- http://www.princetonreview.com/college-education
- https://colleges.niche.com/rankings/best-colleges/
- https://www.prepscholar.com/
- http://nces.ed.gov/collegenavigator/
- http://faculty-salaries.startclass.com/
- https://www.glassdoor.com/Salaries/professor-salary-SRCH_KO0,9.htm
- http://www.payscale.com/college-salary-report/bachelors?page=6
Steven Li is a V Form boarding student from Beijing, China. He is a member of the A Cappella group and an editor for The Parkman Post. He enjoys playing piano, exercising, and traveling with friends.
Gabriel Xu is a V Former from Beijing, China. He is a prefect in Marr & Coolidge. He enjoys playing tennis and is an avid fan of his mother’s cooking.
Finn Reams is a VI Form boarding student from Sacramento, CA. He is the head of the Stock Market Club, a member of the Openly Secular Affinity Group, and the captain of the St. Mark’s men’s varsity crew team.
Thee Ngamsangrat is a VI Form boarding student from Bangkok, Thailand. He lives in Sawyer and loves playing sports.