
By Nathan Cunningham, Ryan Ferland, and Freddy Masri, VI Form
Best Cities to Work and Live
Summary
We were tasked with creating a ranking function on a subject of our choice. We decided that our equation would rank US cities and would output an index indicating the best cities to work and live in. Our ranking is only intended for cities within the United States and does not include surrounding suburbs. The equation takes into account annual salary, annual cost of living, unemployment rate, and poverty rate giving an index anywhere from 0 up to several hundred. The higher the index, the better the city.Introduction and restatement of the problem
The task is to create a multi-variable ranking function, and we chose to rank US cities in order of the best and worst places to work and live. We decided that the most influential statistics for living and working in a city are average annual salary, average annual cost of living, unemployment rate, and poverty rate. A high average salary would contribute to a higher index while high cost of living, unemployment rate, and poverty rate would all contribute to a lower index. Using these criteria, we determined which cities would best fit our model and which would not.
Assumptions and hypotheses
Given that all our city data is from 2014, we assumed that the average salary, average cost of living, poverty rate, and unemployment rate are applicable in 2016. Similarly, we also assumed that we were ranking the cities based on statistics from just the cities’ urban area, which does not include any surrounding suburbs. This makes a big difference as to the size of each city, so we tried to keep it consistent. We also assumed that our four variables gave the most important aspects of work life and could therefore rank entire cities off them. Also, this function is only applicable to those that are qualified to find a job in these cities. Even if a city ranks high on our scale, the people moving there must still have the training and experience necessary to find a quality job in that city. Finally, we are only using our ranking to compare large scale United States cities. Although some small cities or cities in other countries may score very highly on the function, for realistic purposes, only cities of similar size should be compared using the equation. This function will be most accurate and should be primarily used for large cities with a minimum population of 300,000 people.
Analysis of the problem
We had an idea of what our model would take into account, but we needed to find data to determine which direction we would take our function. Our first task was to brainstorm several cities which we imagined are the best in the country. Once we had our initial list, we thought of other cities which would fall towards the middle and bottom of the rank to give us a comprehensive list of cities with a broad spectrum. This list of cities was then finalized by the data we could find for each city. The data we were able to find were for our final variables of average annual salary, average annual cost of living, unemployment rate, and poverty rate. We wanted to include crime as a factor, however, we could not find complete data for each of our cities. When comparing data between our cities, we realized that there was a certain type of city our function would fit. Our function’s target cities are large with a broad array of people living there. For example, we wanted to include a city in Silicon Valley, but, Palo Alto, the typical wealthy city in that area, would not have data that would fit our functions parameters of poverty and unemployment. Also, since our target audience is newly qualified members of society, Palo Alto’s average cost of living would be much too expensive.
Design of the model
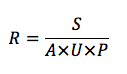
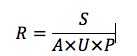
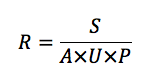
Our model is a function that will rank US cities in terms of quality of life and job availability, giving an output of an index indicating the quality of a city to work and live in. A higher index means a better city. Our model has four variables: average annual salary, average annual cost of living, unemployment rate, and poverty rate: S, A, U, P. Our function is one large fraction with S in the numerator and a product of A, U, and P in the denominator. Since S is a positive attribute of a given city, we put it in the numerator because larger values will increase the index, and A, U, and P are in the denominator because larger values will act to decrease the index. We did not place any coefficients to manipulate the values of our variables because we did not want to skew the index by weighing any of our factors more. We viewed all variables with equal importance. Here is the equation for the model:
Justification of the model
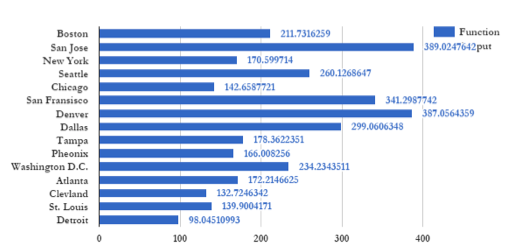
Our model is a good one as it takes into consideration both the positives and negatives of living in a certain city. By placing the average salary in the numerator, and then dividing by the (poverty rate* unemployment rate* the cost of living), we were able to compare the positive aspect (salary) of a city to its negatives. Although a city like New York may have a higher average salary than many places, the high levels of unemployment, poverty rate, and cost of living make it much less desirable for a recently educated and qualified person trying to find a place to live. It must be made clear that these newly educated people are who our model is fitted for. The rich and famous don’t need to worry about poverty rates and the cost of living, but for an upstart person looking to for a city to find a job and live comfortably, these variables are very important. Furthermore, when looking at the large cities which we have plugged into our equation, the rankings make general sense. For example, San Jose, a city right near the booming business region of Silicon Valley, was ranked #1 with an index of 389 due to its extremely high average salary compared to low cost of living and low unemployment rates. Thus, it would be the perfect place for a qualified new member of the workforce. In contrast, Detroit and Cleveland are ranked 14th and 15th due to their low salaries as well as high unemployment and poverty rates. These cities are widely considered to be black holes in terms of places to live and find a job. Overall, our model does a great job of ranking big cities based on their job promise, and as long as you are a qualified up and coming member of the workforce, it is the right equation for you.
Your solution
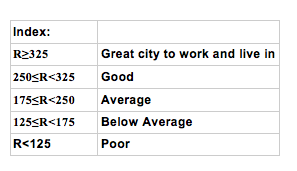
Our solution is the ranking and index for our 15 example cities. Below is a bar graph showing the cities with their respective indexes. The indexes range from below 100 to close to 400, prodding us to create a key to rate individual cities without needing to compare several cities at once. This is ideal because you can quickly see where a city ranks on its own.
- San Jose
- Denver
- San Francisco
- Dallas
- Seattle
- Washington D.C.
- Boston
- Tampa
- Atlanta
- New York
- Phoenix
- Chicago
- Louis
- Cleveland
- Detroit
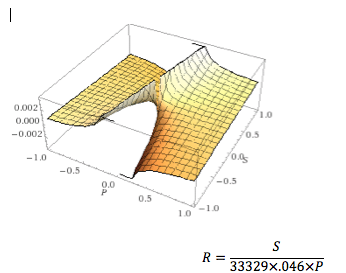
The graph of our function in 3D is a hyperbolic paraboloid with an asymptote plane at 0. R is the vertical axis.
Analysis of the model — strengths and weaknesses
Although we spoke about strengths of our model in the justification section, the overarching positive is that it strongly values salary as a positive and cost of living and unemployment rate as a negative. These factors are the main things that middle class people think about when planning a move to a new city. Thus, for our niche of up and coming qualified workers, our model is spot on.
One clear weakness of our model is that it does only work for our niche of qualified up and coming workers. Wealthy people should certainly not use our model, as they do not need to worry about the cost of living or unemployment rates, as they are already well off. Similarly, it could be argued that our view of cost of living as a negative is not compatible with upper middle class to upper class viewpoints. In fact, many people with large bank accounts prefer to live and say they live in expensive areas, which would view cost of living as a positive. Similarly, if you are looking at your home in terms of an investment, you would want to live in an area with a high cost of living, in order to raise your resale value. Furthermore, our model only works well for comparable large U.S. cities, as smaller or foreign cities may have small sample sizes or other lurking variables that could skew the data. Overall, while our model does a great job in its niche of qualified middle class workers looking to live in large U.S. cities, it is not suited for other categories.
Group contributions and references
All three of us contributed to the research of the data for each city, as well as thinking about how to craft the equation that became our model. Then, Freddy worked on putting everything into an excel spreadsheet, as well as making all of our graphs. Nathan was then in charge of the analysis and design of the model part of the write up. Finally, Ryan was in charge of the assumptions, justification, and strengths and weaknesses. Below are our sources, data, and initial notes.
- Salary
- Employment/unemployment rate
- Annual cost of living
Average commute
Crime rates
Poverty rate
Cost of living:
http://www.businessinsider.com/cost-of-living-single-people-2015-8
http://www.epi.org/resources/budget/
http://www.payscale.com/cost-of-living-calculator/Michigan-Detroit
Unemployment rate:
http://www.bls.gov/web/metro/laummtrk.htm
College employment:
https://nces.ed.gov/fastfacts/display.asp?id=561
Poverty:
http://www.thehoya.com/dc-poverty-rate-increases/
Crime:
https://en.wikipedia.org/wiki/List_of_United_States_cities_by_crime_rate_(2014)
http://www.city-data.com/crime/crime-Boston-Massachusetts.html
Boston (population: 645,966)
Avg. salary: $72,000 (indeed.com)
Unemployment rate: 4.0% (Bureau of Labor Services http://www.bls.gov)
Annual cost of living: $39,358 (Business insider)
Poverty rate: 21.6% (Boston Redevelopment Authority)
Crime index: 343.3 (city-data.com)
San Jose (population: 998,537)
Avg. salary: $81,000 (indeed.com)
Unemployment rate: 3.9% (Bureau of Labor Services http://www.bls.gov)
Annual cost of living: $41,386 (epi.org)
Poverty rate: 12.9% (citydata.com)
Crime index: (city-data.com)
New York (population: 8,406,000)
Avg. salary: $78,000 (indeed.com)
Unemployment rate: 5.1% (Bureau of Labor Services http://www.bls.gov)
Annual cost of living: $43,519 (Business insider)
Poverty rate: 20.6% (Census.gov)
Crime index: (city-data.com)
Seattle (population: 652,405)
Avg. salary: $62,000 (indeed.com)
Unemployment rate: 5.3% (Bureau of Labor Services http://www.bls.gov)
Annual cost of living: $32,122 (Business insider)
Poverty rate: 14% (Census.gov)
Crime index: (city-data.com)
Chicago (population: 2,719,000)
Avg. salary: $69,000 (indeed.com)
Unemployment rate: 6.8% (Bureau of Labor Services http://www.bls.gov)
Annual cost of living: $31,334 (Business insider)
Poverty rate: 22.7% (Census.gov)
Crime index: (city-data.com)
San Francisco (population: 837,442)
Avg. salary: $78,000 (indeed.com)
Unemployment rate: 3.8% (Bureau of Labor Services http://www.bls.gov)
Annual cost of living: $43,581 (Business insider)
Poverty rate: 13.8% (Census.gov)
Crime index: (city-data.com)
Denver (population: 649,495)
Avg. salary: $55,000 (indeed.com)
Unemployment rate: 3.1% (Bureau of Labor Services http://www.bls.gov)
Annual cost of living: $28,829 (Business insider)
Poverty rate: 15.9% (Census.gov)
Crime index: (city-data.com)
Dallas (population: 1,258,000)
Avg. salary: $59,000 (indeed.com)
Unemployment rate: 3.7% (Bureau of Labor Services http://www.bls.gov)
Annual cost of living: $27,627 (Business insider)
Poverty rate: 19.3% (Census.gov)
Crime index: (city-data.com)
Tampa (population: 352,957)
Avg. salary: $50,000 (indeed.com)
Unemployment rate: 4.5% (Bureau of Labor Services http://www.bls.gov)
Annual cost of living: $28,316 (Business insider)
Poverty rate: 22% (Census.gov)
Crime index: (city-data.com)
Phoenix (population: 1,513,000)
Avg. salary: $48,000 (indeed.com)
Unemployment rate: 4.6% (Bureau of Labor Services http://www.bls.gov)
Annual cost of living: $28,187 (Business insider)
Poverty rate: 22.3% (Census.gov)
Crime index: (city-data.com)
Washington, D.C. (population: 658,893)
Avg. salary: $72,000 (indeed.com)
Unemployment rate: 4.1% (Bureau of Labor Services http://www.bls.gov)
Annual cost of living: $42,119 (Business insider)
Poverty rate: 17.8% (Census.gov)
Crime index: (city-data.com)
Atlanta (population: 447,841)
Avg. salary: $72,000 (indeed.com)
Unemployment rate: 5.3% (Bureau of Labor Services http://www.bls.gov)
Annual cost of living: $31,303 (Business insider)
Poverty rate: 25.2% (Census.gov)
Crime index: (city-data.com)
Cleveland (population: 390,113)
Avg. salary: $51,000 (indeed.com)
Unemployment rate: 4.1% (Bureau of Labor Services http://www.bls.gov)
Annual cost of living: $26,106 (Business insider)
Poverty rate: 35.9% (Census.gov)
Crime index: (city-data.com)
St. Louis (population: 318,416)
Avg. salary: $58,000 (indeed.com)
Unemployment rate: 5.2% (Bureau of Labor Services http://www.bls.gov)
Annual cost of living: $27,683 (Business insider)
Poverty rate: 28.8% (Census.gov)
Crime index: (city-data.com)
Detroit (population: 688,701)
Avg. salary: $60,000 (indeed.com)
Unemployment rate: 5.4% (Bureau of Labor Services http://www.bls.gov)
Annual cost of living: $28,474 (PayScale.com)
Poverty rate: 39.8% (Census.gov)
Crime index: (city-data.com)
Actual function
Rank – R
Salary – S
Unemployment rate – U
Annual cost of living – A
Poverty rate – P
http://www.livability.com/best-places/top-100-best-places-to-live/2016?page=1
http://247wallst.com/special-report/2015/11/05/americas-50-best-cities-to-live-2-2/
http://www.businessinsider.com/us-news-best-big-cities-to-live-in-america-2016-3