Home » Posts tagged 'Annotated Diagram'
Tag Archives: Annotated Diagram

How Do Candles Burn? A Chemistry Annotated Diagram
By Catie Summers, V Form
How Do Candles Burn? A Chemistry Annotated Diagram
Teacher’s Note: In 1848, physicist Michael Faraday delivered a series of holiday lectures at the Royal Institution in London on the topic of “The Chemical History of a Candle.” During the lectures, Faraday used his observations of a burning candle as inspiration for relating, to a lay audience, a veritable encyclopedia of fundamental principles of physics and chemistry. In Honors Chemistry at St. Mark’s, we strive to recreate Faraday’s sense of wonder by performing simple experiments on a candle and interpreting the results in light, based on what we have learned about atoms, molecules, and chemical reactions. Students are challenged to determine the nature of a candle’s fuel and describe the process by which a candle’s flame perpetuates itself. In particular, Catie Summers’s eye-catching visual summary of this process reflects her efforts to link macro-scale observations with molecule-level interpretations.


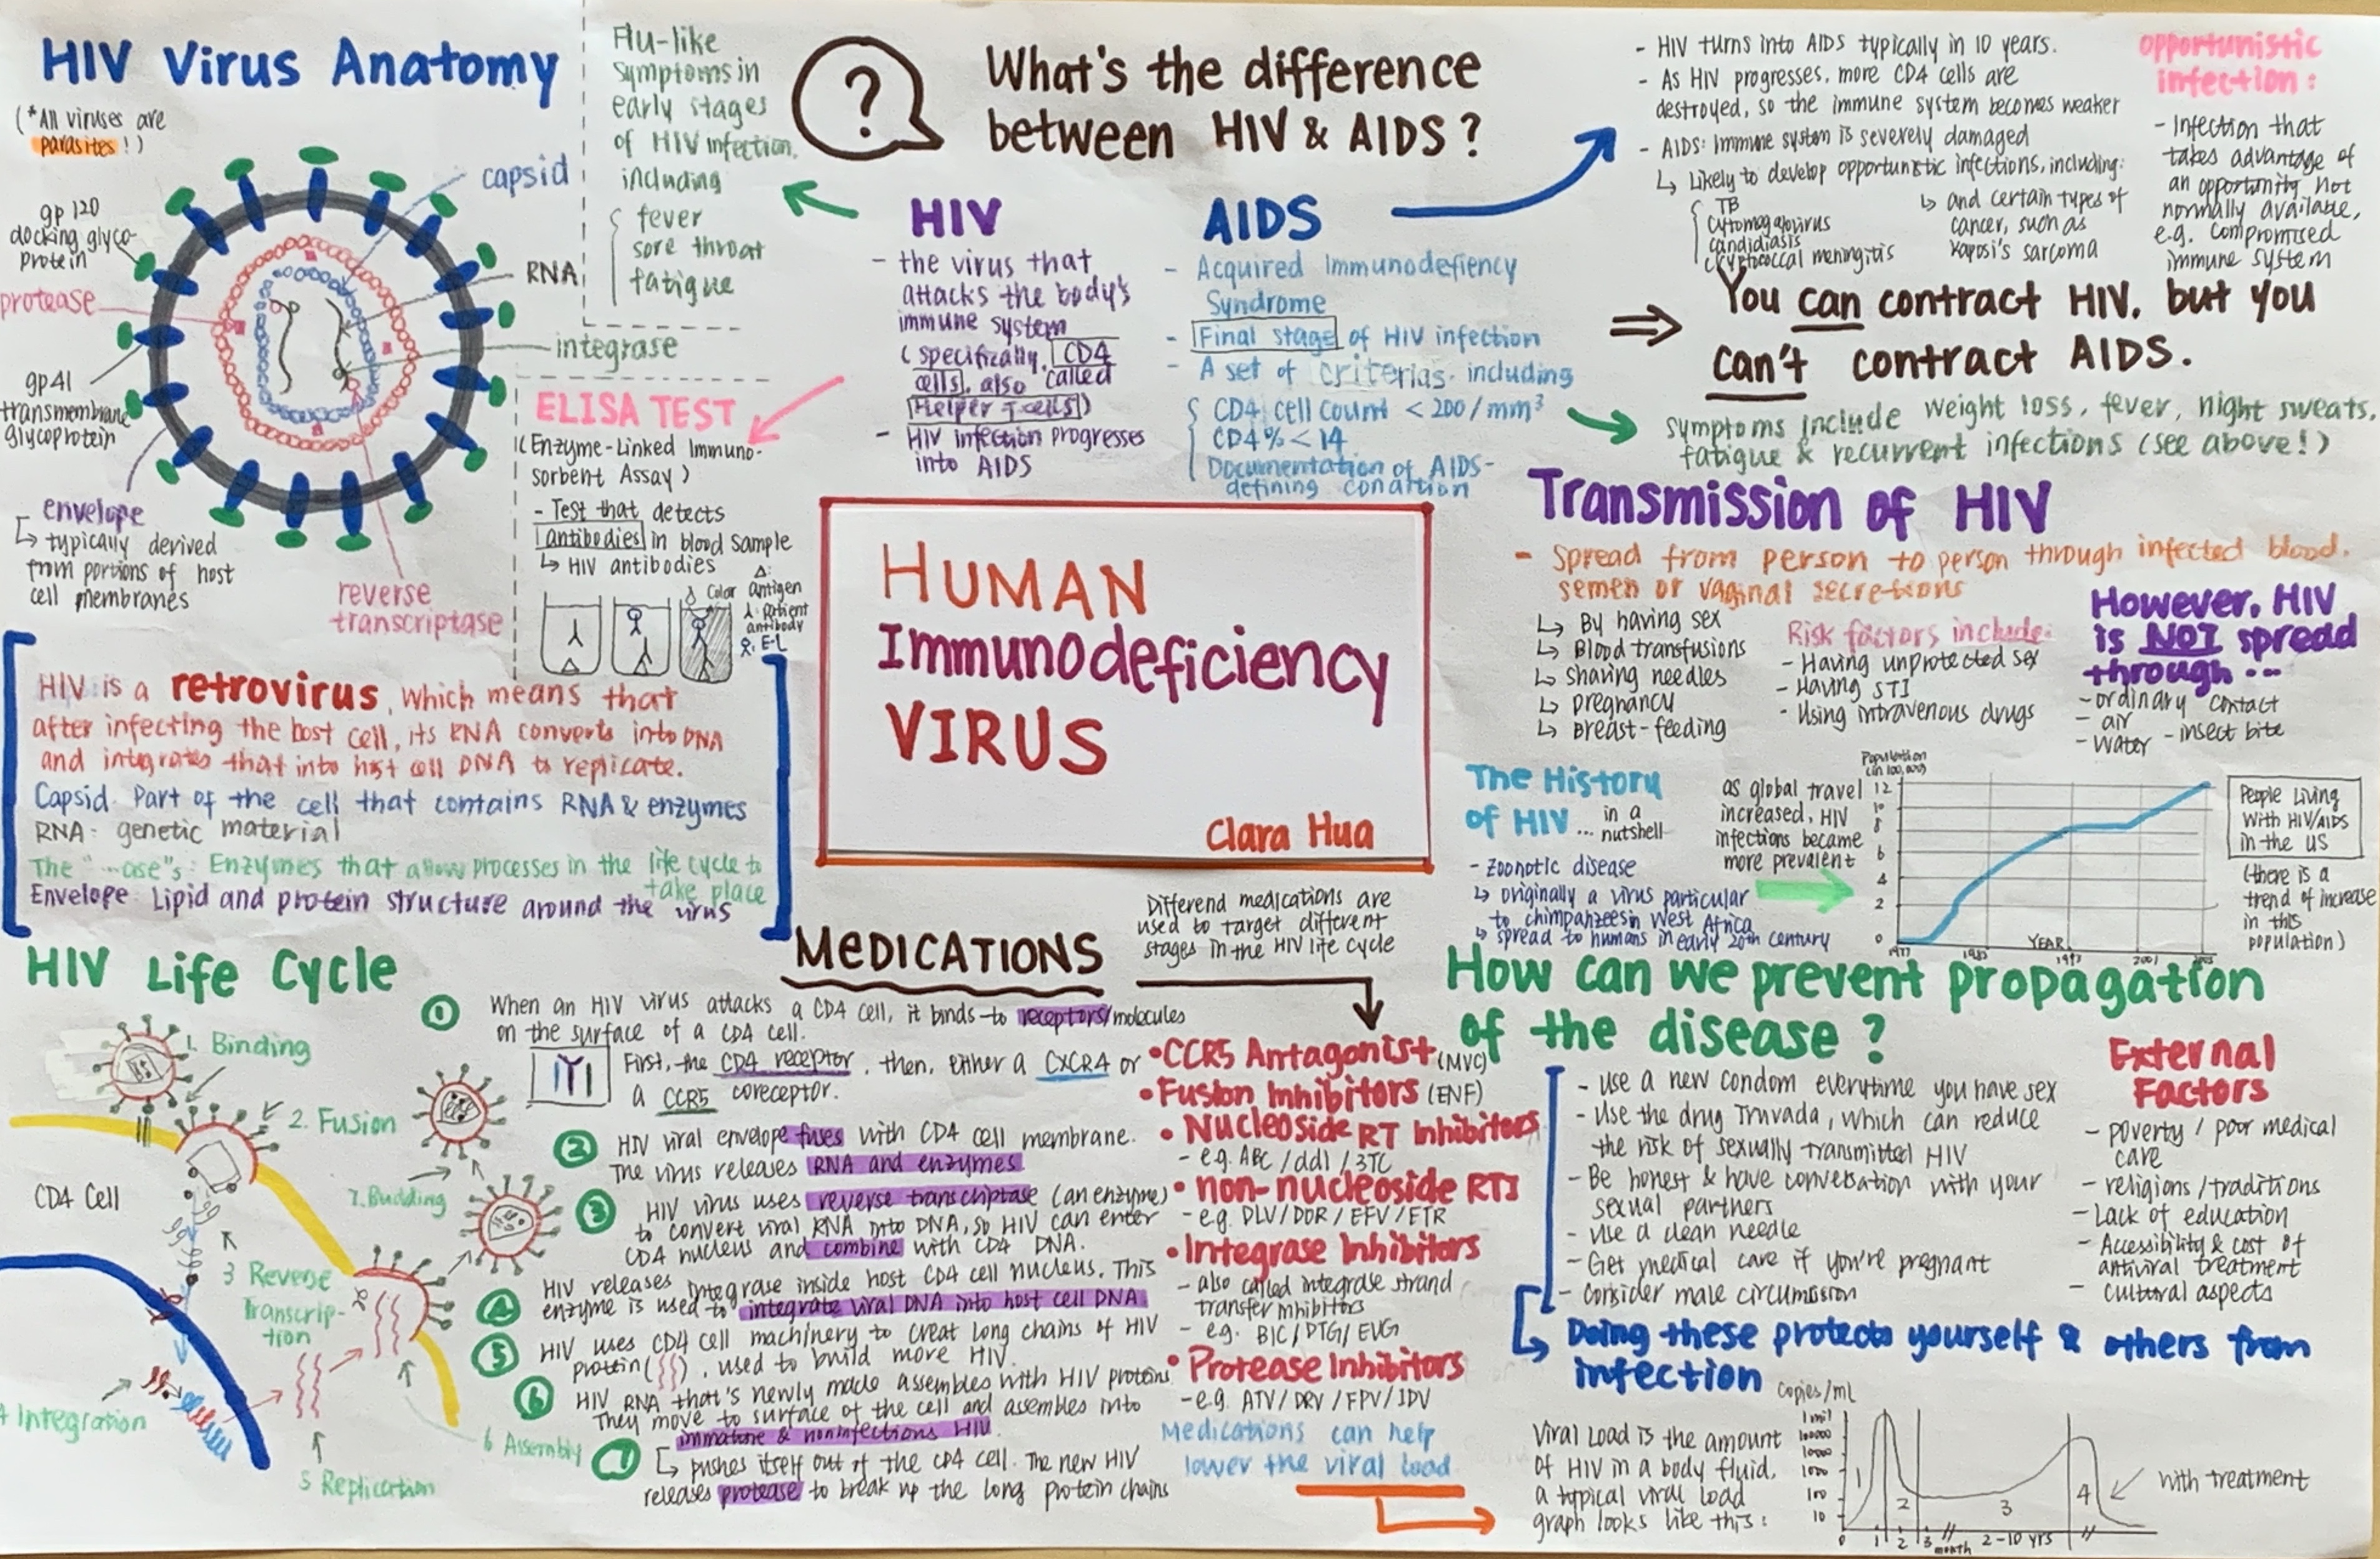
Annotated Diagram: Human Immunodeficiency Virus
By Clara Hua, IV Form
Annotated Diagram: Human Immunodeficiency Virus
Editor’s Note: The “Biology 30” class zoomed in to examine the cellular (and sub-cellular) impacts and zoomed out to consider some of the economic, geo-political, environmental and cultural factors that have an influence on the spread of this disease. An Annotated Diagram is a formal sketchnote that aims to demonstrate understanding of the information by presenting how the information (the full story of HIV/AIDS) was processed.